One radio. The whole band.
A single-radio LoRa / MeshCore / LoRaWAN spectrum & traffic analyser.
LoRaScope is a single-radio analyser that listens to the LoRa band and tells you what’s actually happening on it. It captures traffic live, decodes packets, and turns raw airtime into a clear picture of your spectrum — so you can see who’s talking, how often, and whether the link is healthy.
<div class="lh-shot-cap">Decode config</div>
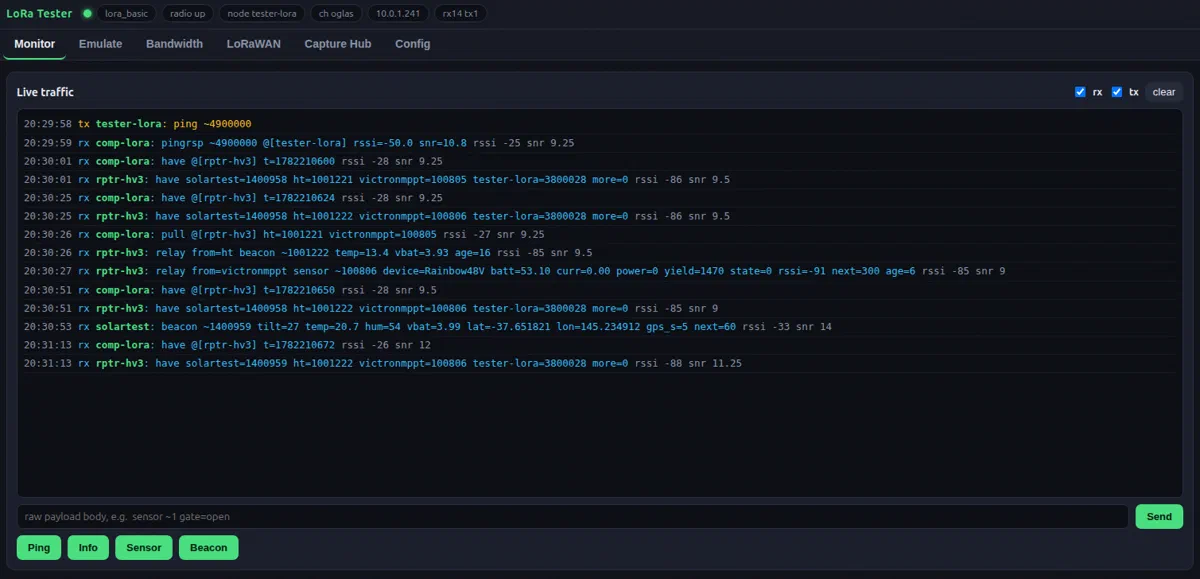
Decode any LoRa sender
Match the sender's sync word, spreading factor, bandwidth, and coding rate and LoRaScope decodes raw LoRa frames the moment they hit the radio — no gateway, no join, no network server. Just the bytes on the air.
<div class="lh-shot-cap">Capture store</div>
Capture & store
Save decoded LoRa frames to a capture store, then filter, search, and export them later. Build a record of every packet that crossed the band — for debugging, auditing, or replay.
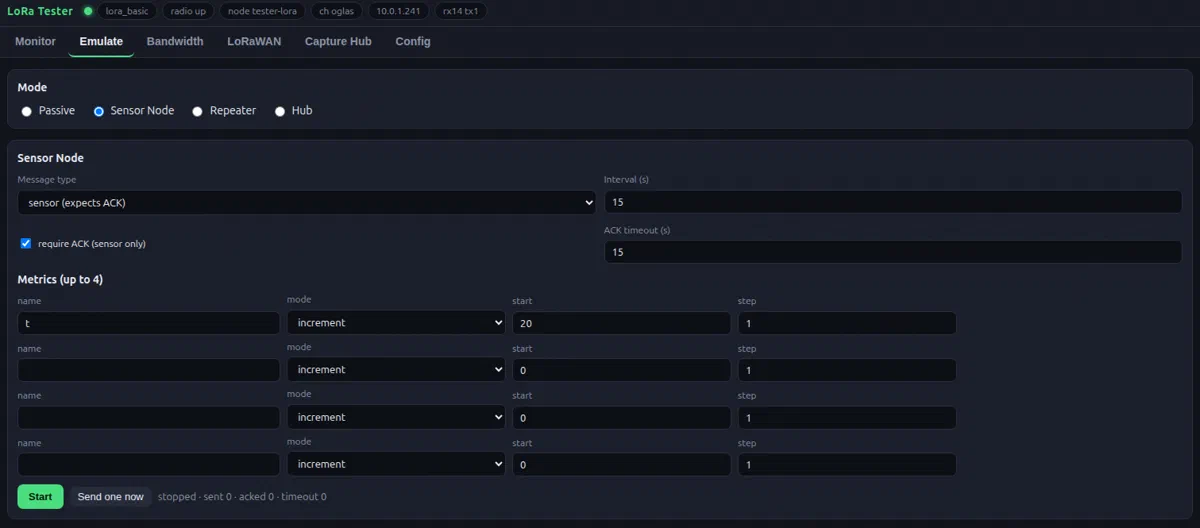
<div class="lh-shot-cap">Emulate</div>
Emulate & inject
Replay captured traffic and inject test packets to stress a link or reproduce a fault — without touching your field hardware. Build timed sequences, group sends, and canned payloads to exercise a gateway exactly the way real traffic would.
The same controls are exposed over telnet and REST, so an AI agent (or any script) can drive inject and emulate directly — see AI & automation.
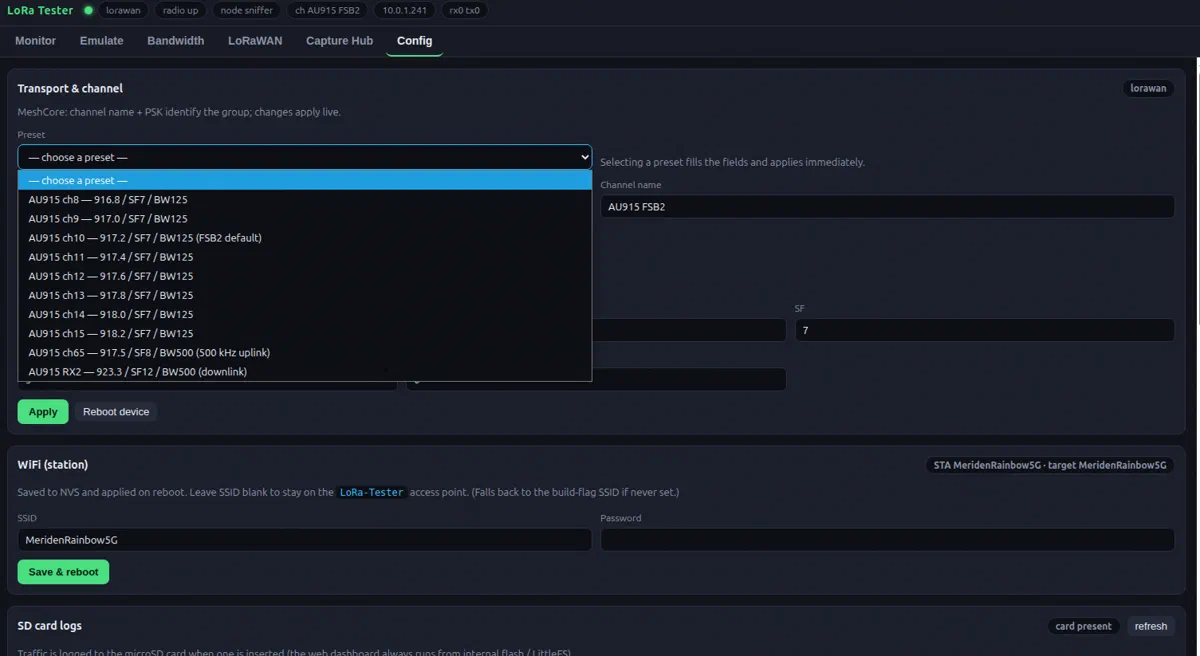
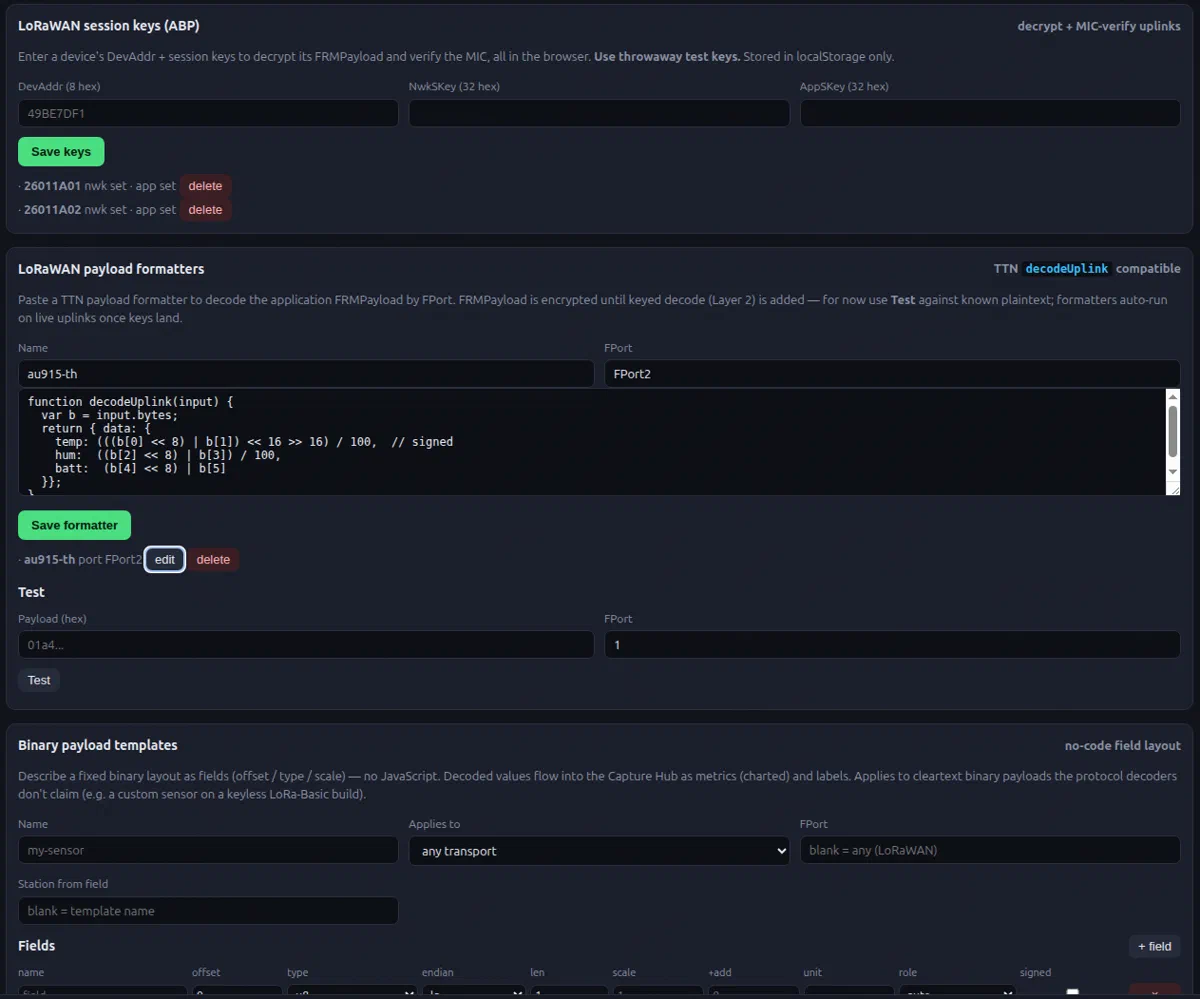
<div class="lh-shot-cap">Config</div>
Full radio config
Set frequency, spreading factor, bandwidth, coding rate, sync word, and node identity from one screen. Save profiles per site, switch between them in a click, and see the live radio state at a glance.
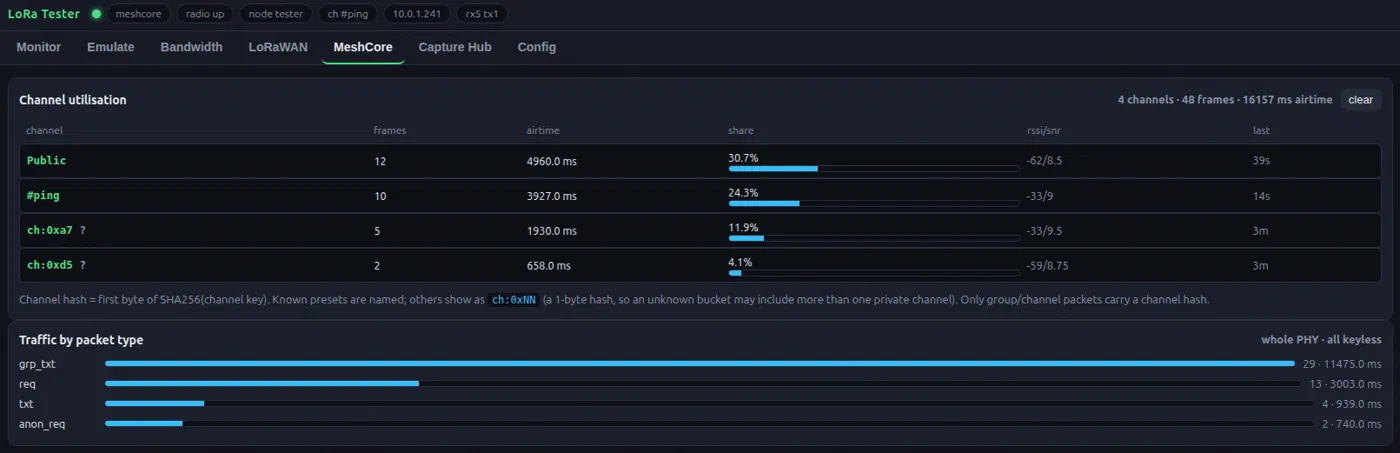
<div class="lh-shot-cap">MeshCore</div>
MeshCore station map
Decode MeshCore and LoRaWAN traffic, map the mesh, and characterise each link — range, margin, and where packets get lost. See every station on the air, how strong they hear you, and where the mesh is weakest.
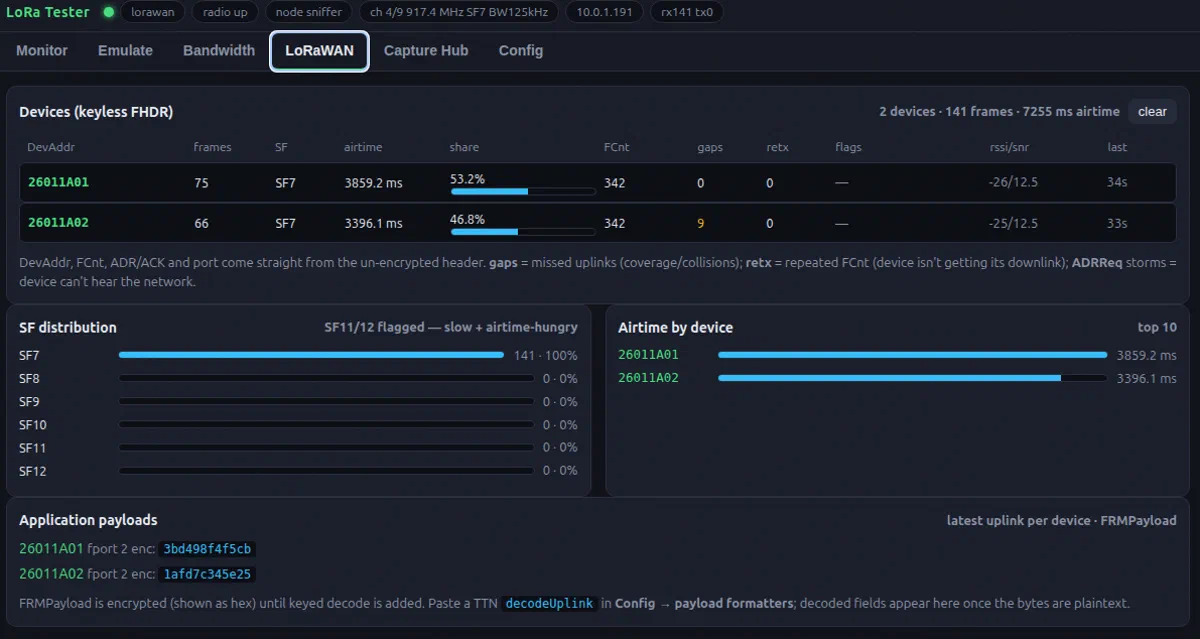
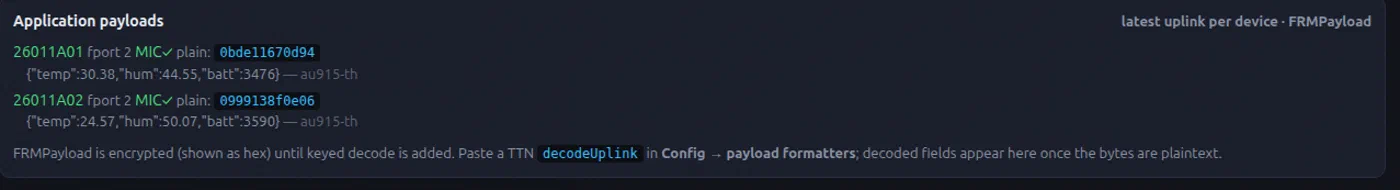
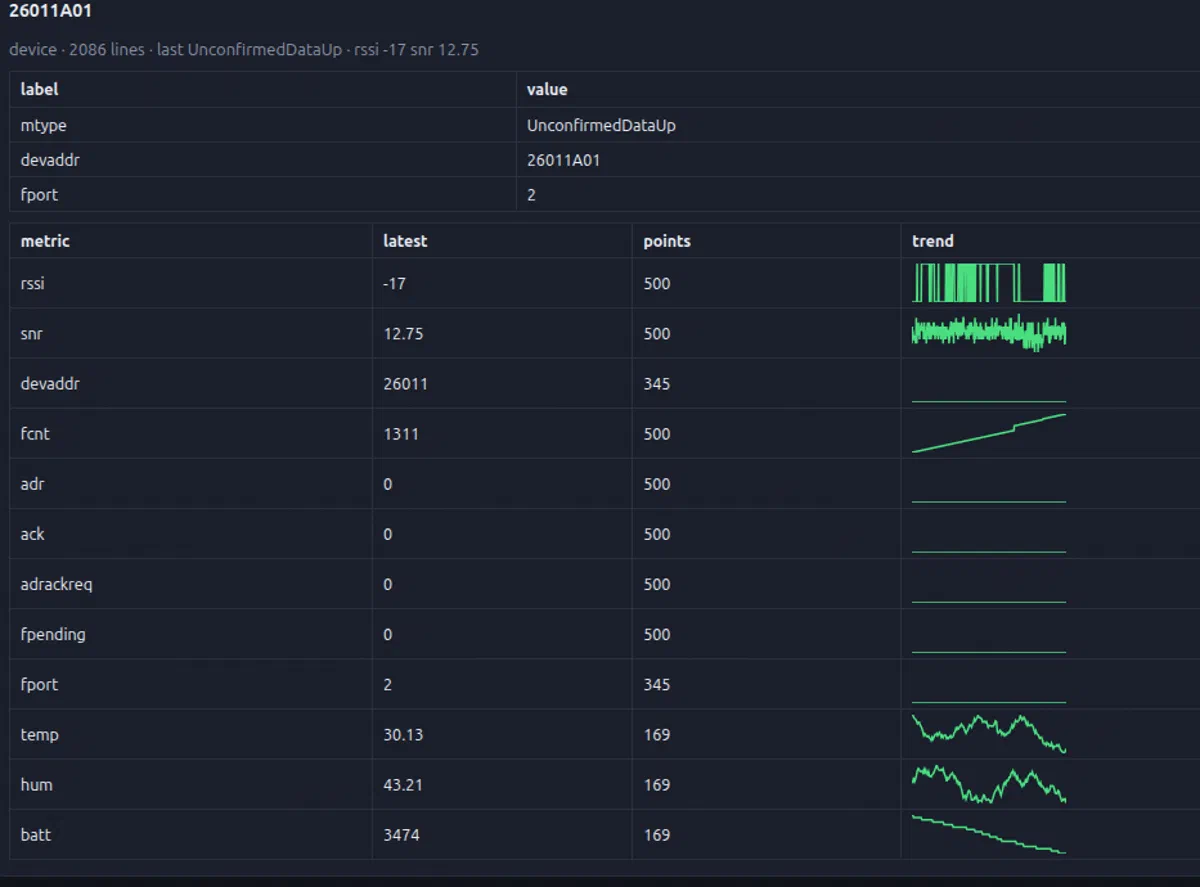
<div class="lh-shot-cap">LoRaWAN decode</div>
LoRaWAN decoding
Decode join requests, MAC commands, and uplink payloads in real time. See DevAddr, port, FCnt, and frame metadata at a glance — no external gateway needed, the single radio hears it all.
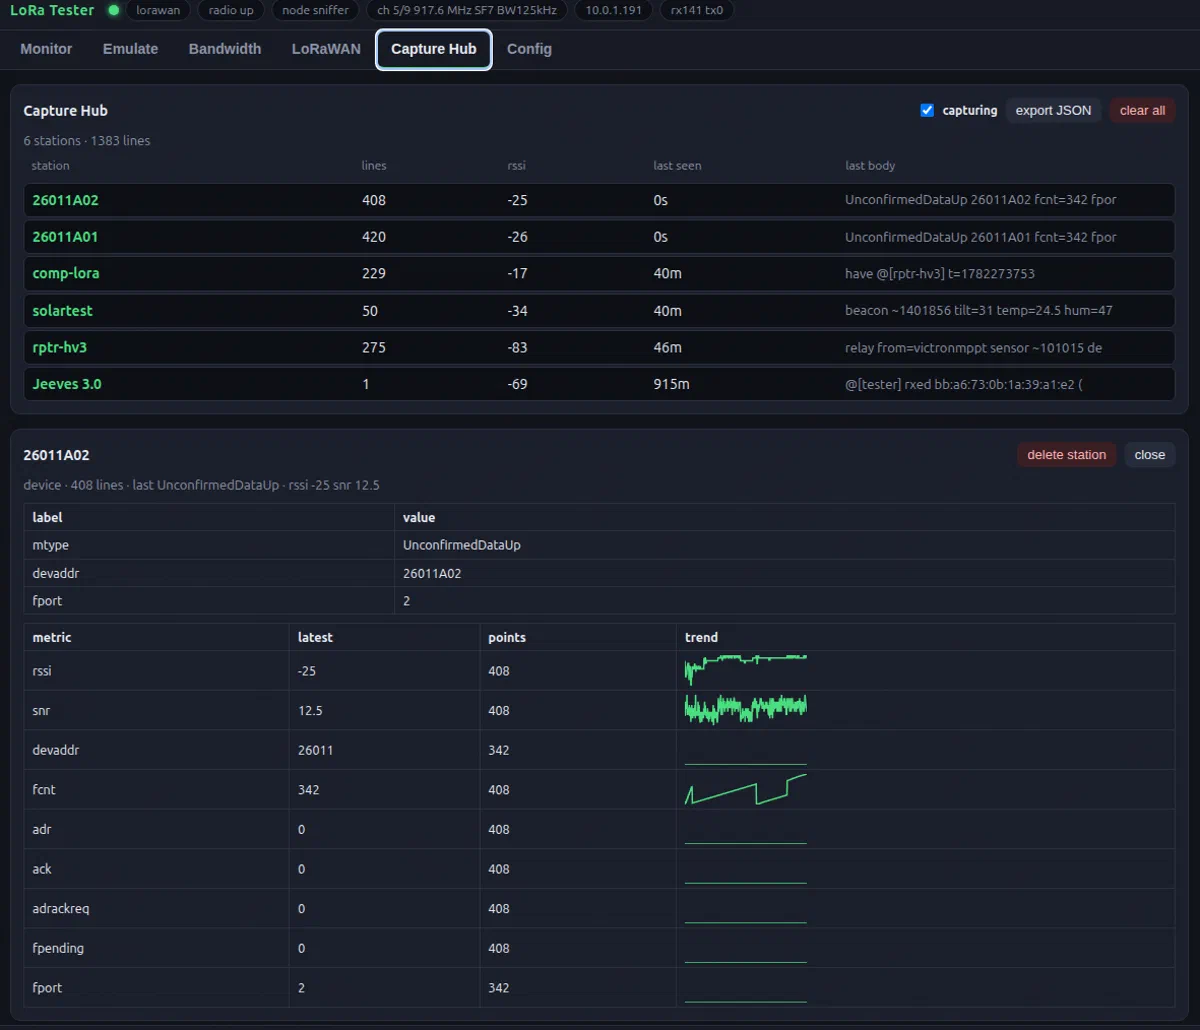
<div class="lh-shot-cap">Capture hub</div>
Capture & replay
Record LoRaWAN traffic to a log, filter by device or channel, and replay captured frames to test a gateway or reproduce a fault — all from the same single radio.
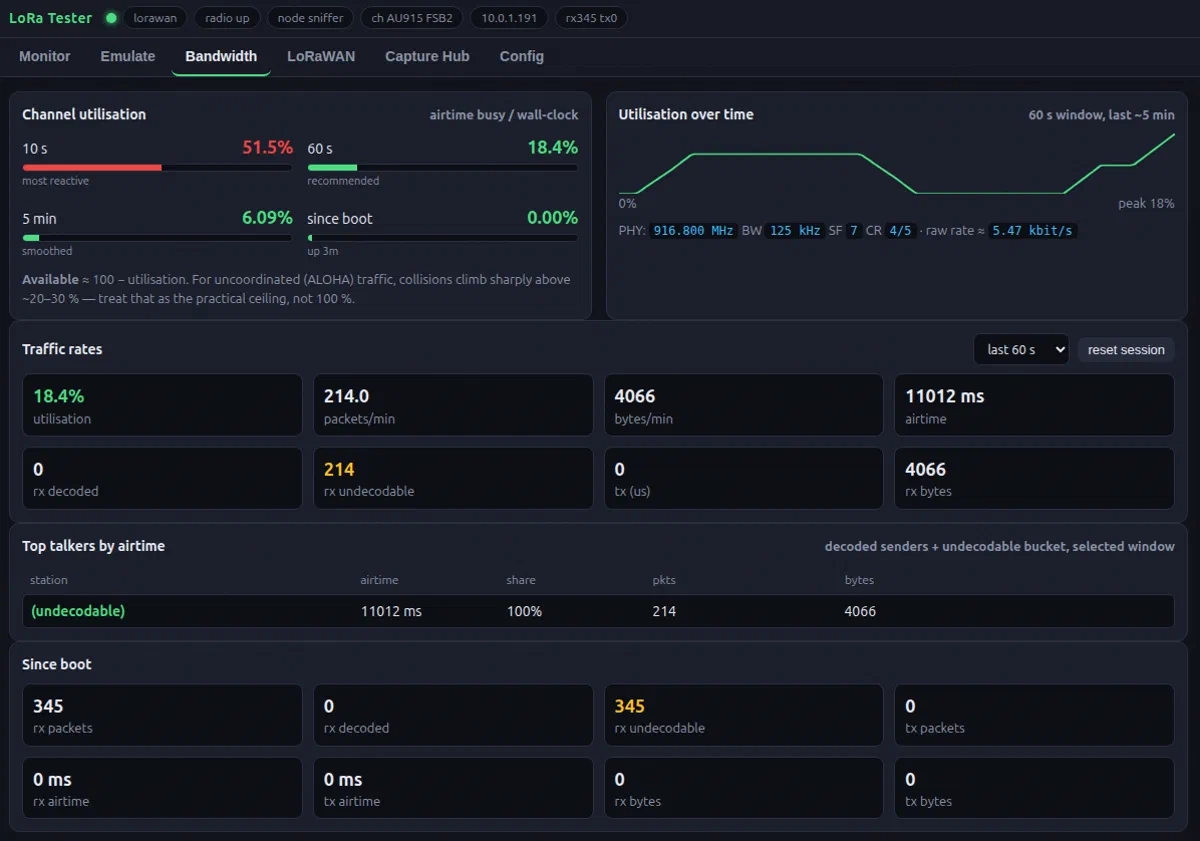
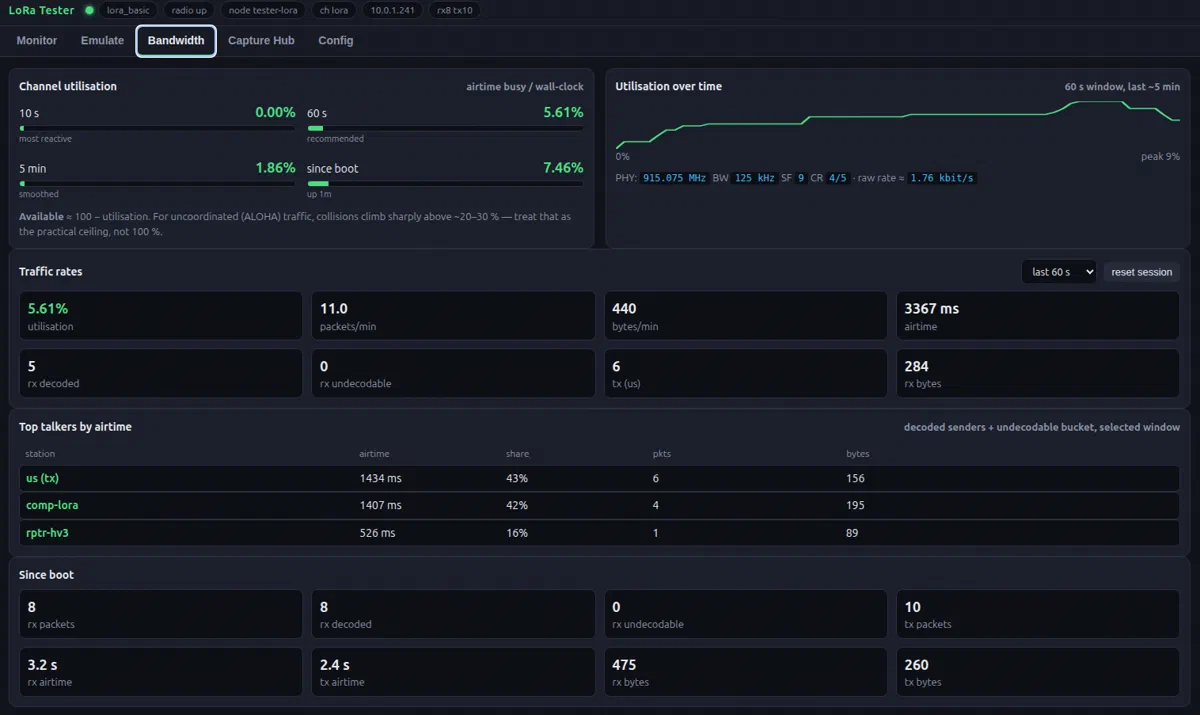
<div class="lh-shot-cap">Bandwidth</div>
Bandwidth & duty cycle
Measure real throughput, duty cycle, and time-on-air against the regulatory budget across every channel. See who's hogging the band, how much headroom is left, and whether your gateway is hitting its listen-before-talk limits.
<div class="lh-shot-cap">Plugins — custom JS on the live feed.</div>
Write your own custom JS plugins
Handle anything the built-in decoders don't. The analyser runs your own JavaScript plugins against every packet on the air — custom payload decoders, site-specific alerting, exports to the system of your choice, or a bespoke view of the band. Drop a plugin in, reload, and it's live on the same traffic feed as everything else.
SD-card logging
Log every packet to SD as both human-readable CSV and raw frame captures — ready for post-processing, replay, or audit. Runs unattended in the field.
OTA updates
Over-the-air firmware updates keep the analyser current without a laptop on site — new decoders and features ship to deployed boxes as they land.
WiFi & AP mode
Join existing WiFi to stream captures to a laptop, or spin up its own access point in the field — connect straight to the box with no router required.
Three protocol modes
Switch between LoRaBASIC (with payload decoders), LoRaWAN (frame formatters and payload templates), and MeshCore (channel monitoring with bandwidth analysis grouped by channel) — one box, every flavour of LoRa.
Channel scanning
Automatic scanning across channels finds who’s talking and where, including advanced LoRaWAN scanning that hunts join requests and uplinks across the whole regional band.
What it runs on
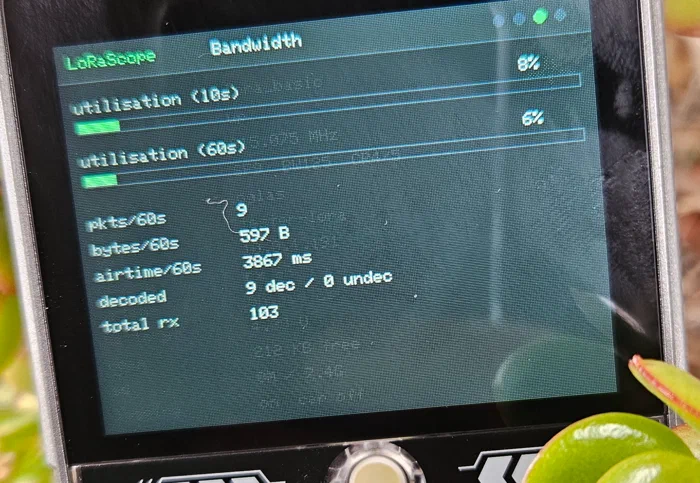
No proprietary box. LoRaScope runs on a handful of common parts and a browser — build one yourself or have us build and tune it for your site.
One radio, one box. Compact, low-power, and easy to drop in alongside your existing gateway — LoRa, MeshCore, or LoRaWAN.
Want it on your site, or a feature it doesn’t have yet? That’s the expertise side — or reach out directly.